PiTCH: Sportlogiq Soccer Data Platform
Conceiving and launching a B2B AI-powered data and video platform


Background
Sportlogiq uses Computer Vision and Machine Learning to produce real-time data and insights.
With the NHL as their main historical client, Sportlogiq is the leader in ice hockey analytics using cutting-edge AI to change the game.
Goal
The company were successful in applying the technology to soccer, but needed an intuitive UI product built from scratch in order to give soccer clubs well-rounded quantitative insight in their historically subjective evaluations.
Role
As the Senior Product Designer, and project lead, I was responsible for:
- Identifying gaps in the soccer data market
- Analysing data & working with analysts, soccer coaches, trainers and soccer club data teams to create meaningful metrics & insights
- Validating customer demand for features and data insight coupling
- Organising data to highlight most important statistics for each position type or team data within different competition contexts
- Designing data visualisation and interactions which linked to video examples
- Working with scouts to ideate introducing of video playlists and data-backed presentations to for club pitches
Team
1 senior product manager
3 data analysts
4 front-end developers
2 back-end developers
1 QA
3 MONTH TURN AROUND
Outcomes
Clubs who had participated in free alpha-testing signed up to become paying customers:
83% conversion rate
Secured funding for
15 leagues: 9000+ players from 300+ teams
Helped the US Women’s National Team
win the 2019 World Cup
DISCOVER
User & Market Research
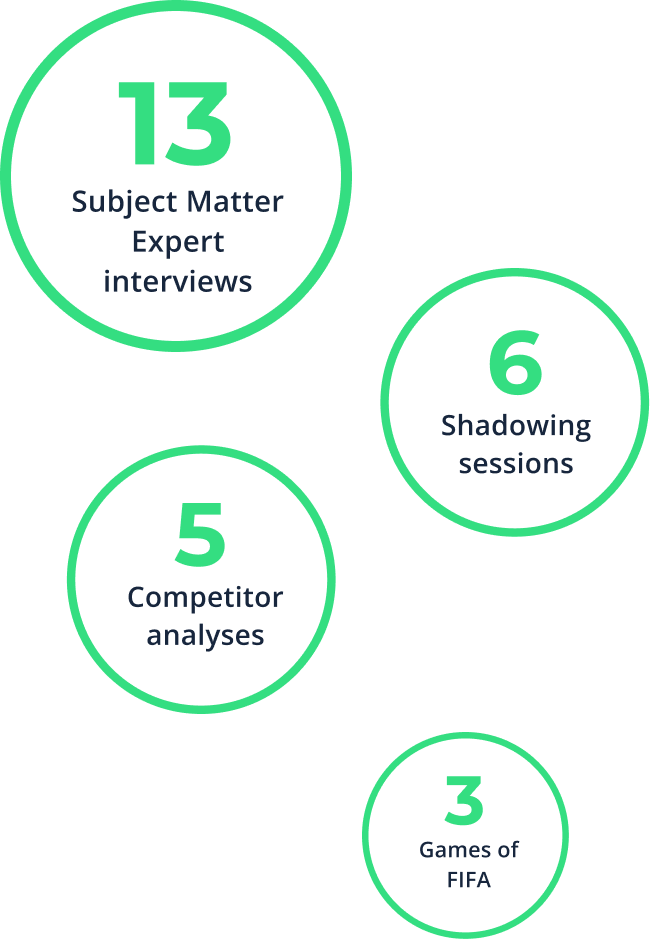
In order to understand potential market fit, and user needs, research was carried out with a number of existing API customers as well as prospective customer from soccer clubs in Canada, The United States, and Europe.
In addition, existing soccer data solutions and their offerings were explored, evaluated, and potential users who currently use those tools were interviewed to ascertain pain points and opportunities.
DISCOVER
Findings
- Scouts and coaches (main identified user types) are not particularly data-literate
- The user types rely heavily on video examples to analyse and communicate which the current market doesn’t address alongside data
- Methods of collecting and analysing video and performance data is manual, tedious, and prone to inaccuracies
- Currently available tools display raw numerical data which do not easily translate into useful insights
- Current tools’ functionality makes it difficult to compare players and teams, especially across leagues
- Existing industry benchmarks for data vizualisation lack accuracy and positional/league context
- Analysis is limited to the frames contained within broadcast video, restricting a holistic team formation view

DEFINE
Problem Statement
How might we create an intuitive UI for our soccer data that provides accurate actionable insights and comparisons, showcases our unique data offerings, and integrates video seamlessly without alienating non-data-minded users?
DEFINE
Scope
Through collaborating closely with the senior product manager, working with the following a number of discovery interview sessions with industry SMEs, user personas’ day-to-day responsibilities were investigated, broken down and 3 main product areas were identified to serve them:
1. Player profiles & comparisons
To give the user a comprehensive visual view of a positional players’ strengths and weaknesses, and to measure them up to other players in different leagues.
2. Team profiles & comparisons
To allow the user to perform team ways-to-win and post-game analysis: using contextual location data to discover patterns.
3. Video Linking & player positioning
To facilitate video analysis which backs up the data in order to build trust in new metrics, and streamline strategy sessions and club presentations.
4. Top Players & Teams
To aid scouts in their discovery, highlighting teams and players to focus on when visiting certain leagues and countries.
DISCOVER
Metrics Research
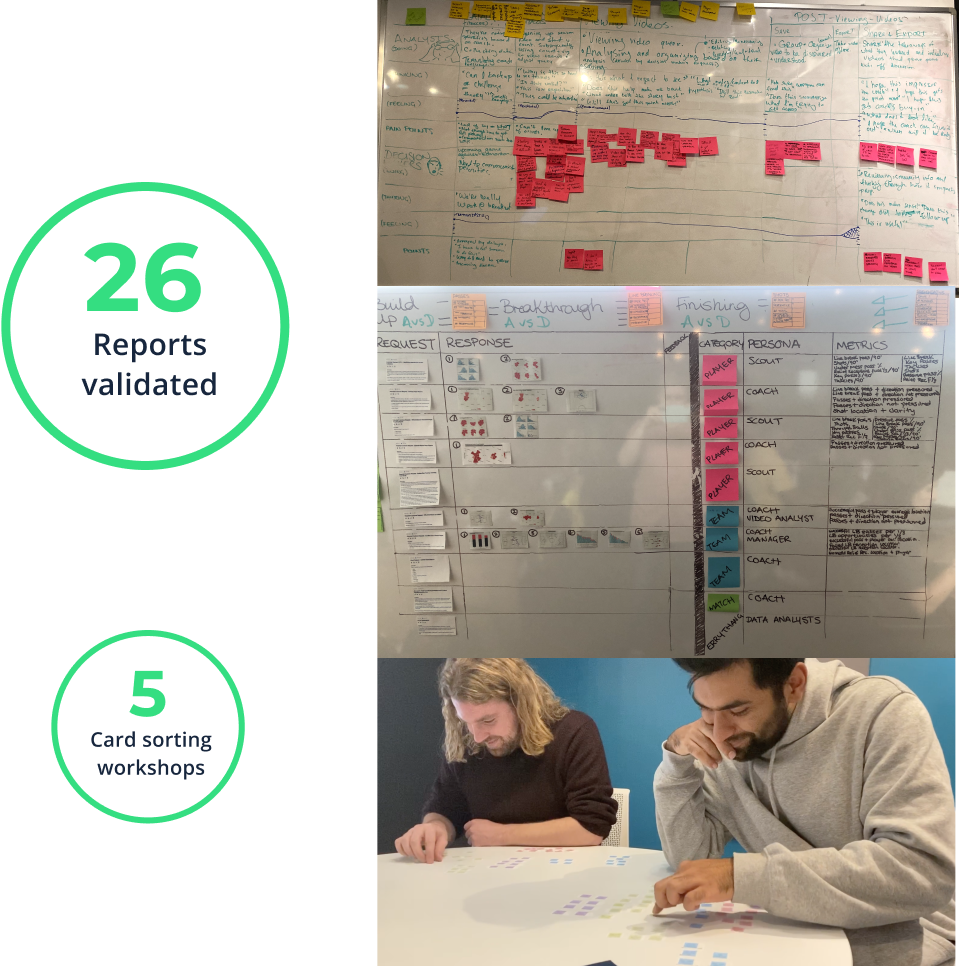
Multiple workshop sessions were held with SMEs, soccer coaches, scouts, and data/video analysts to understand what data they would need to see how a player may perform across different leagues or in different clubs and how important each data end-point is for different player positions.
Reports were created and broken down with the Sports Data team in order to verify and validate data points and insights with partnered clubs and their data teams.
IDEATE
Iterative Designs
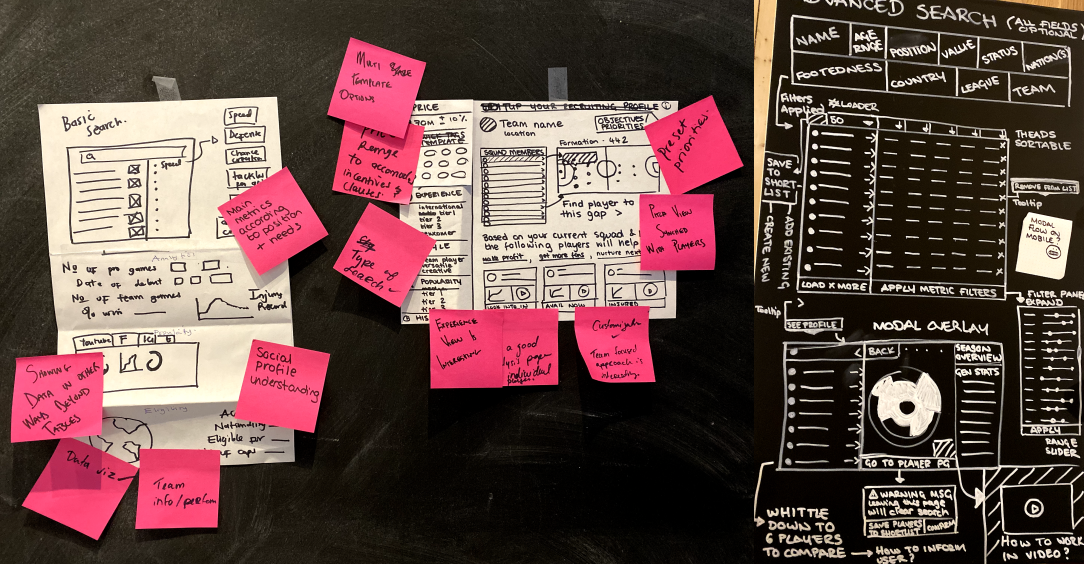
Designs and prototypes were regularly shared with SMEs, potential clients, data analysts, clubs and investors for feedback and validation, the findings analysed, and designs improved upon.
DELIVER
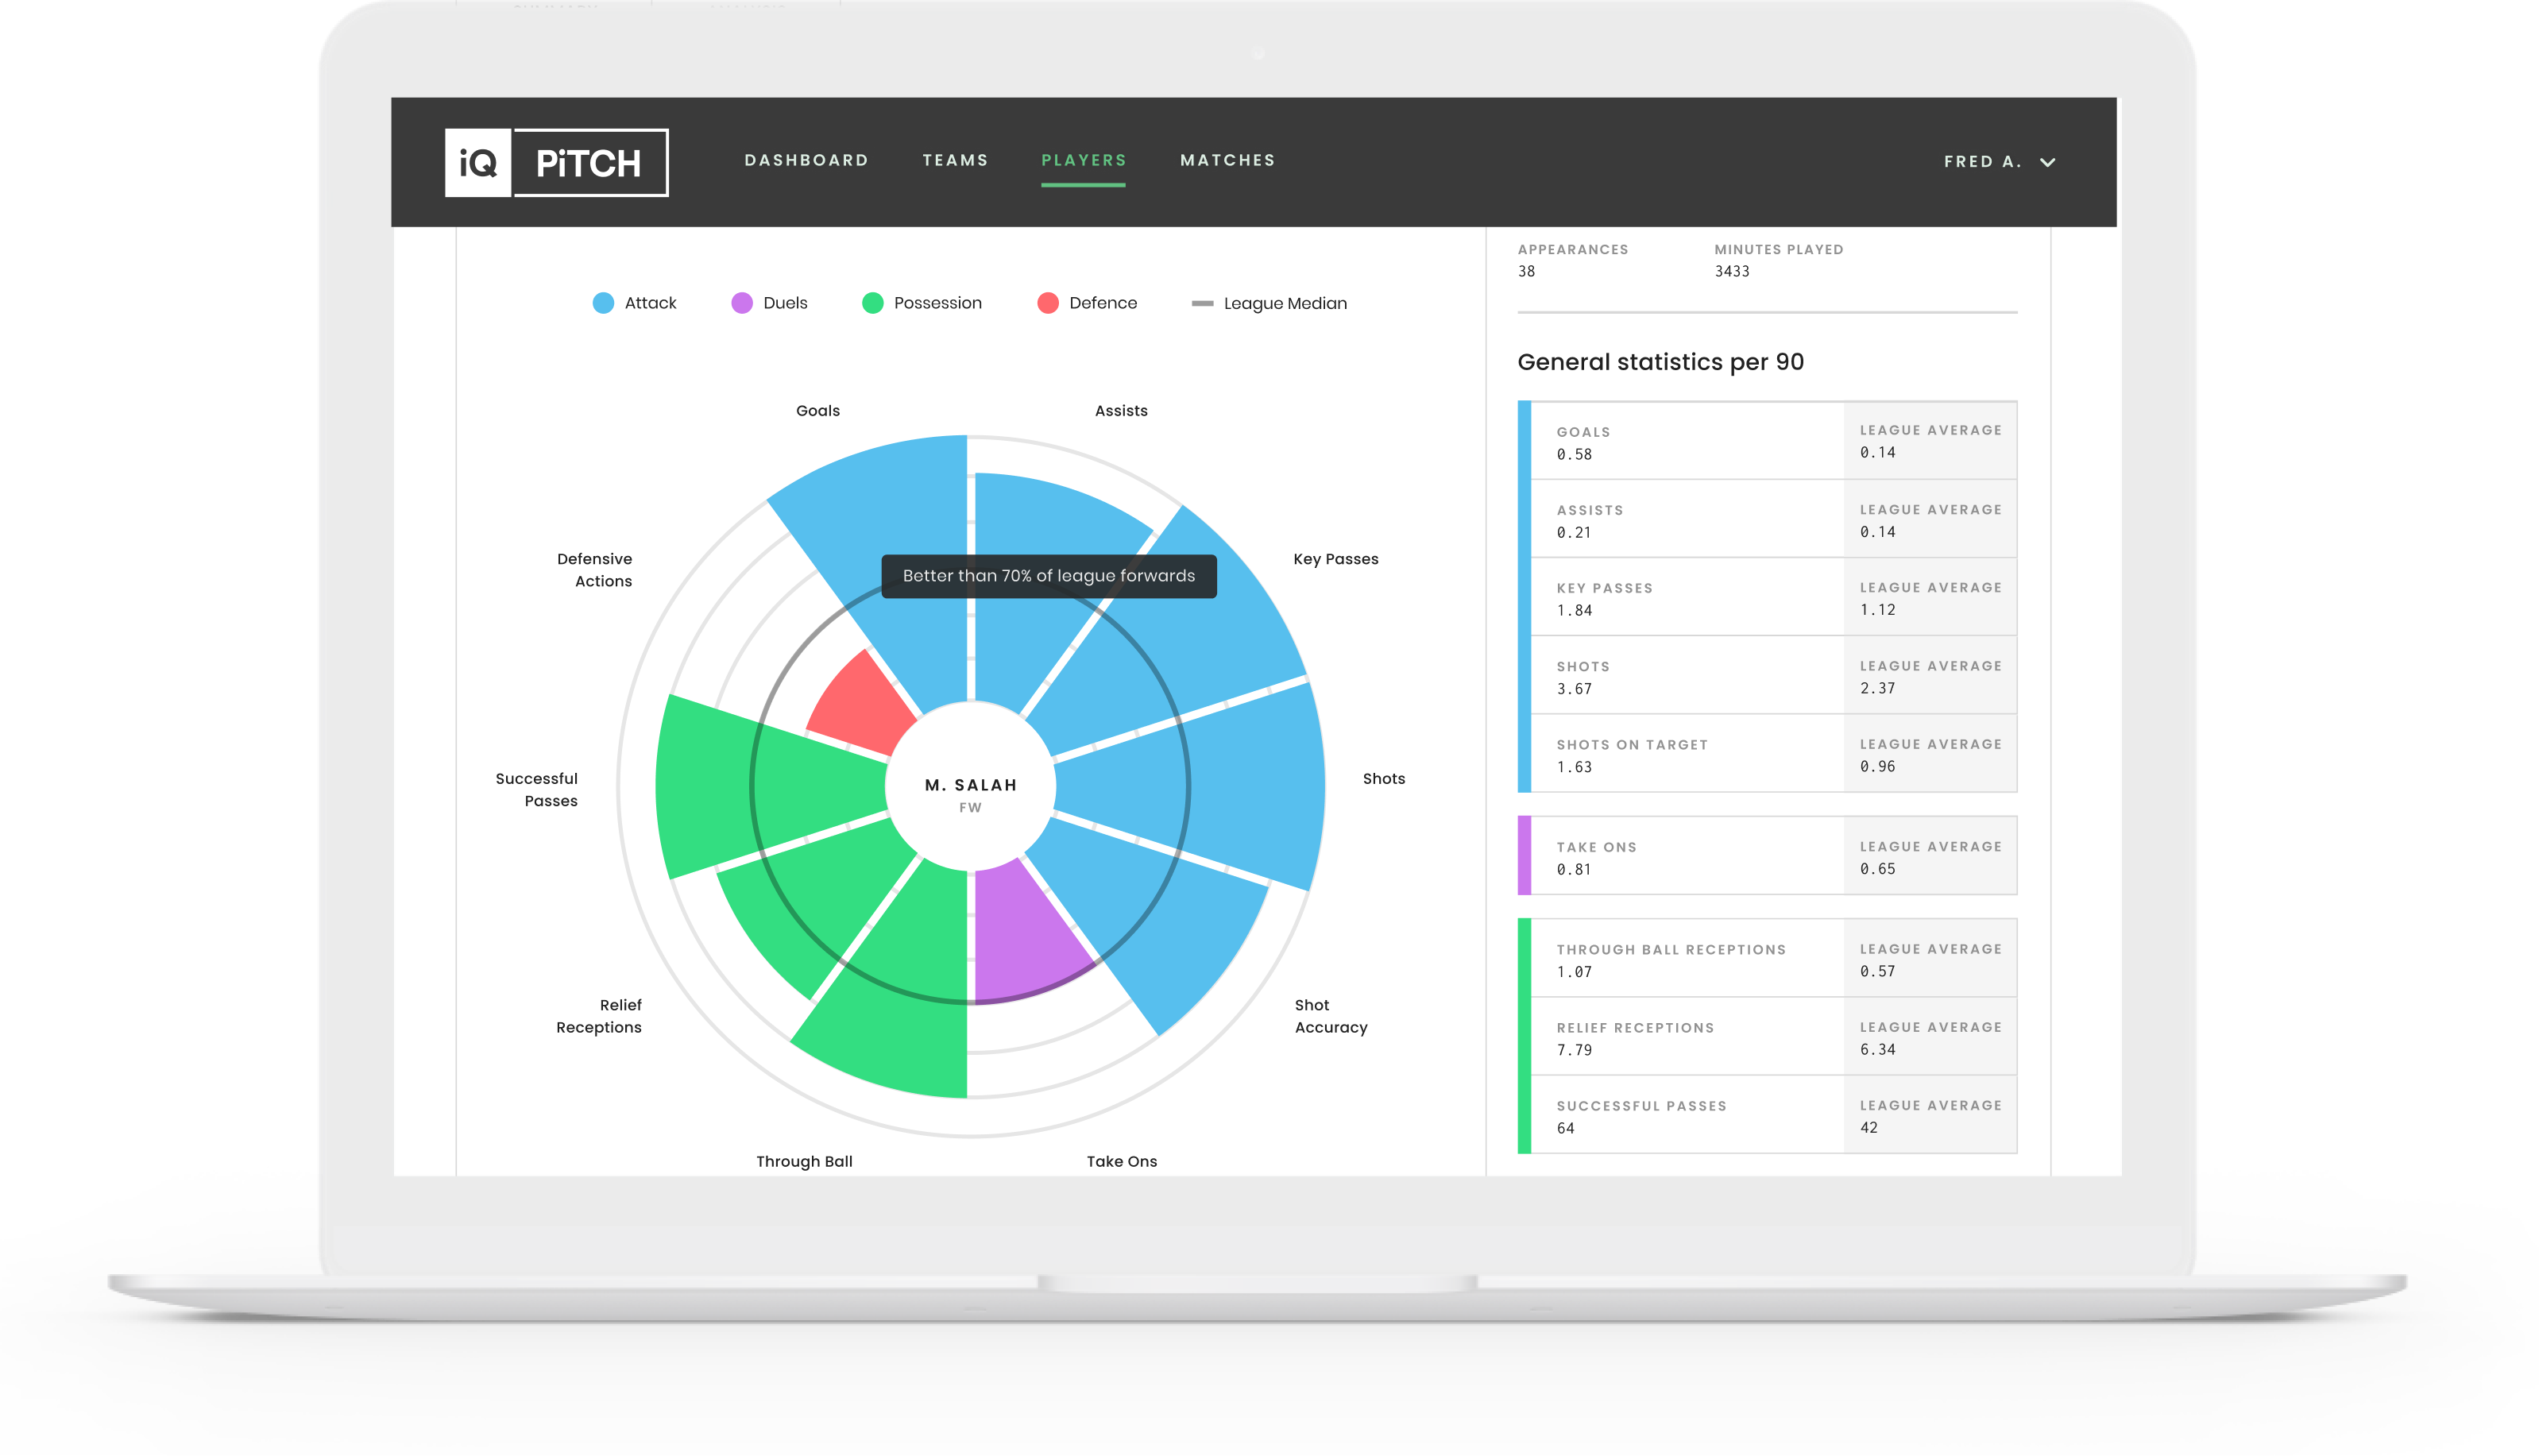
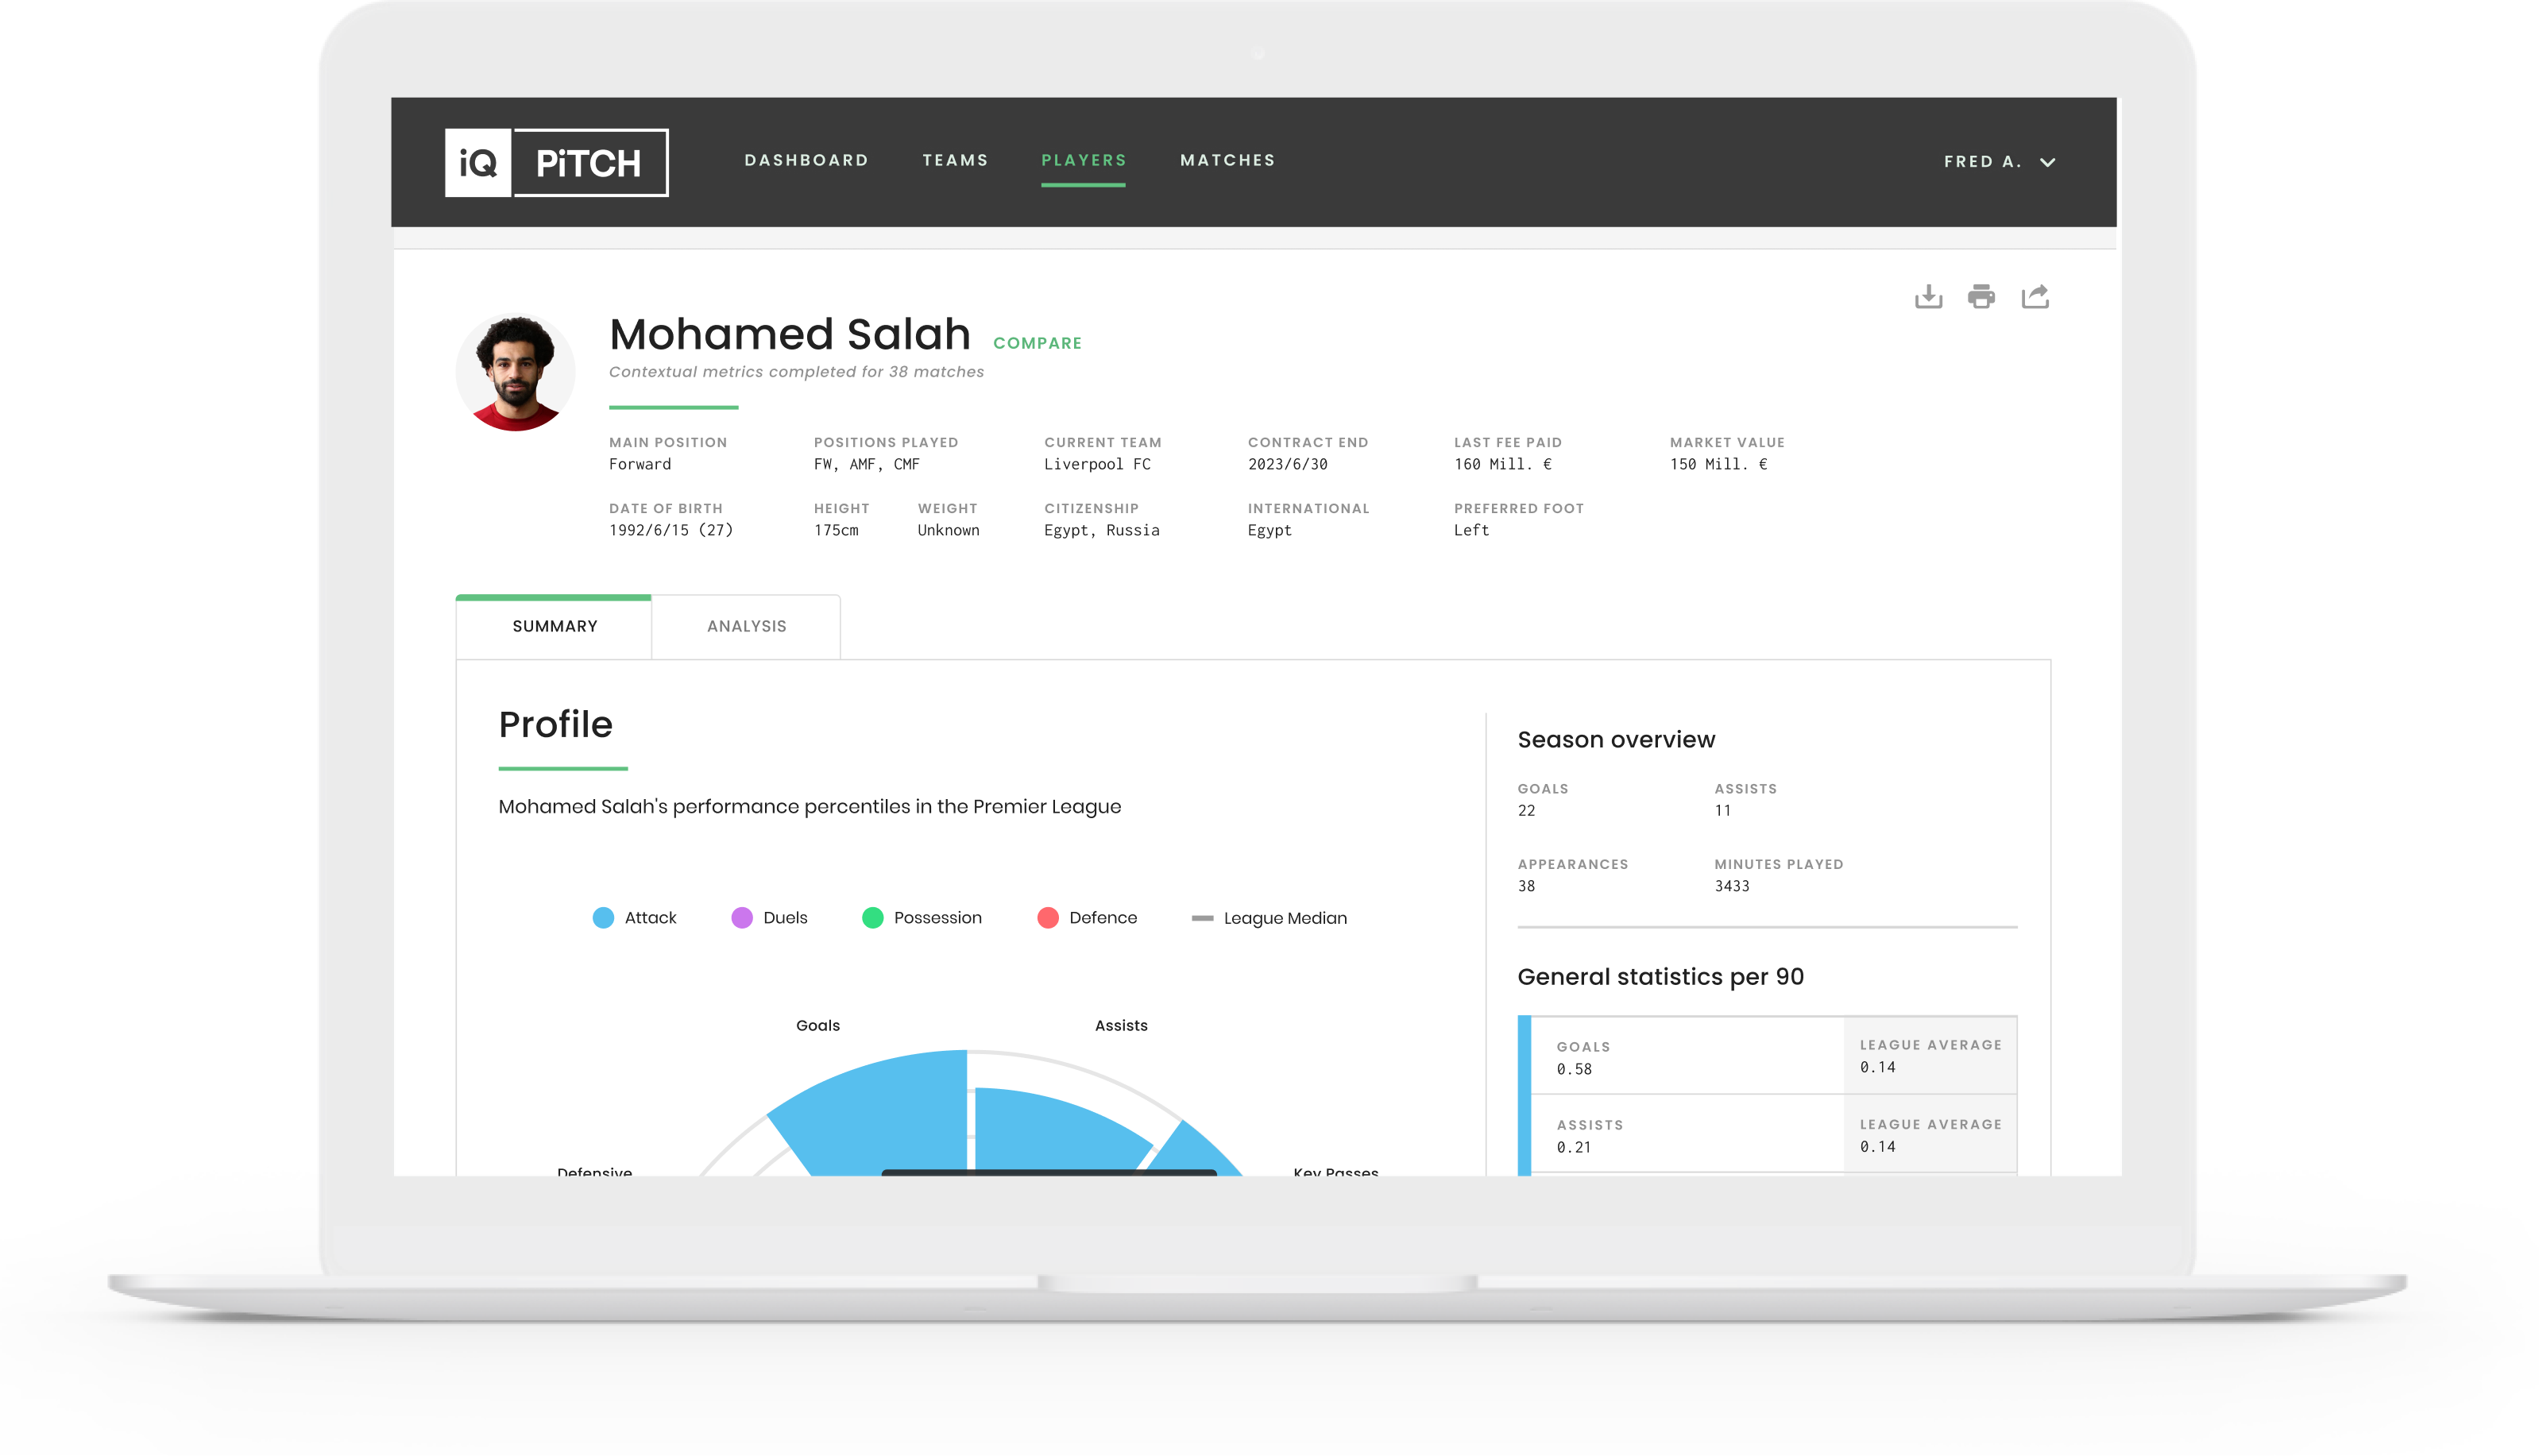
Player Profiles & Comparisons
The data on each player’s page varies to show information relevant to the players’ position.
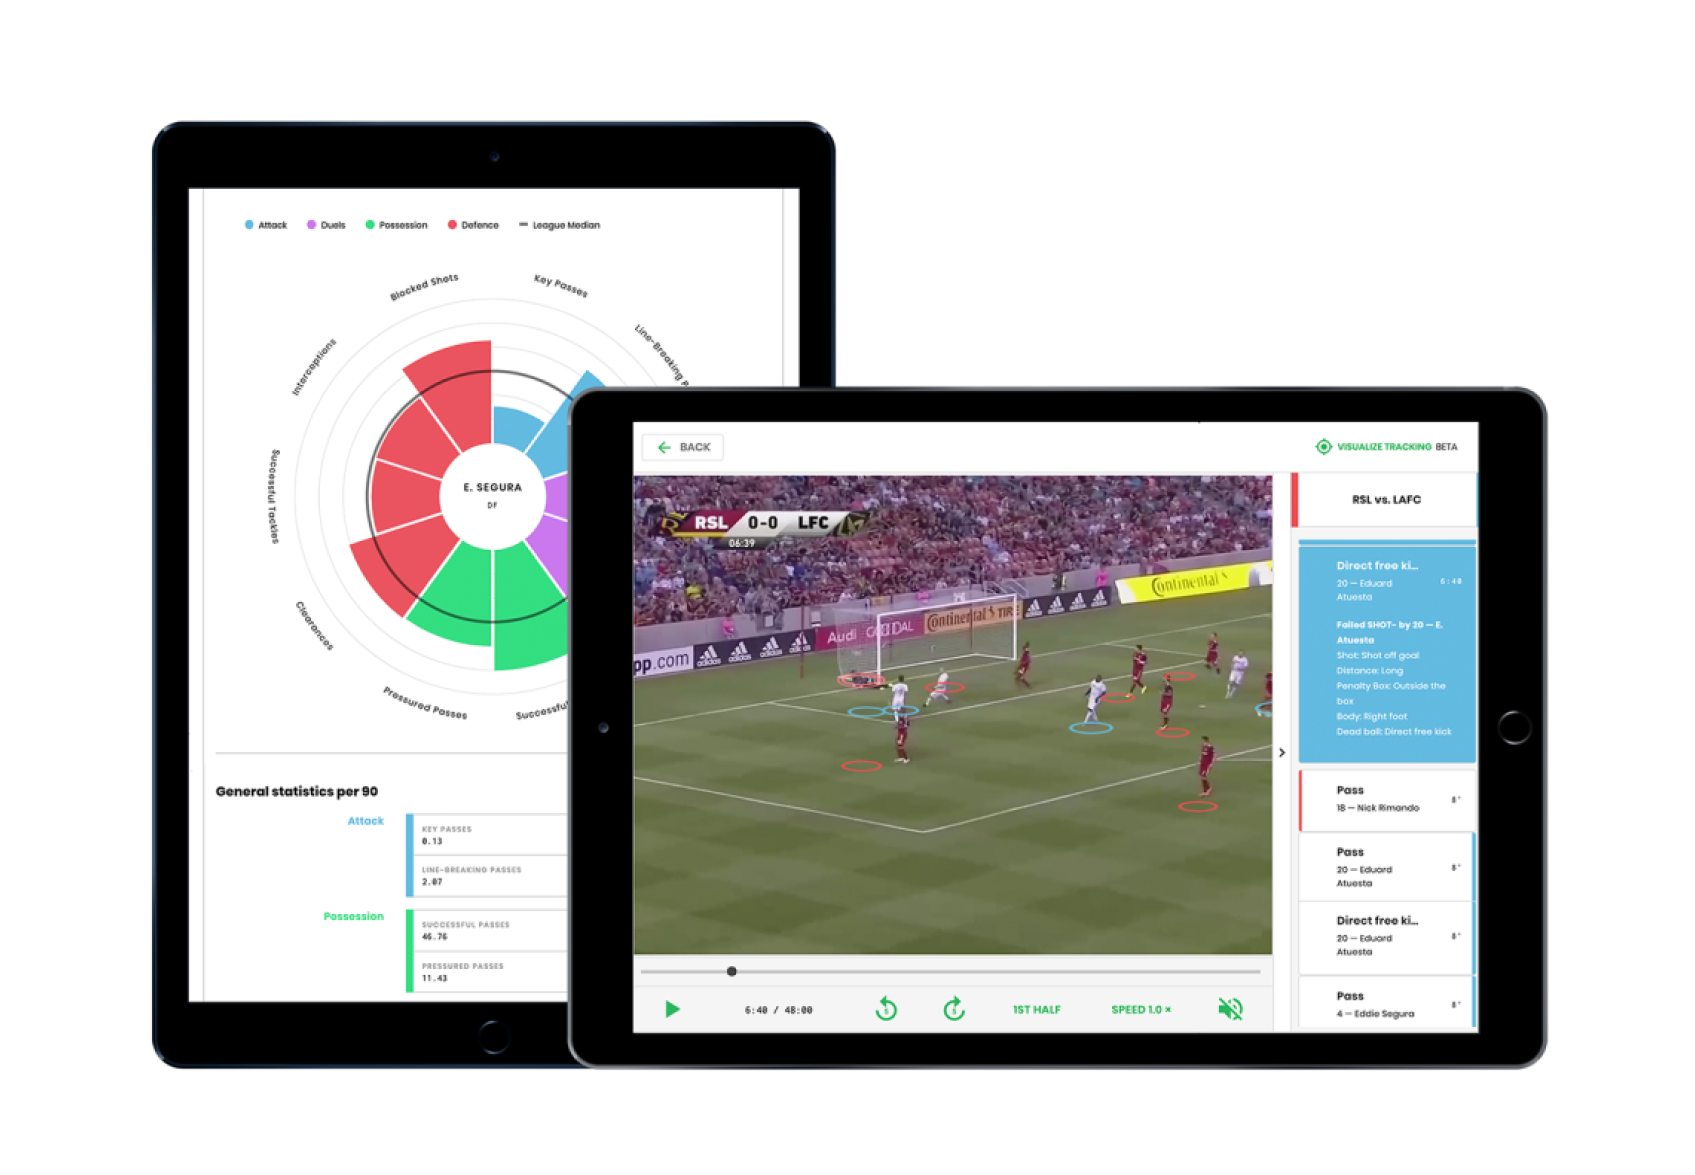
By using a radar pie chart to understand player data, the user can see an accurate visual display of performance matched up with the League Median to show the player’s skills in relation to a league.
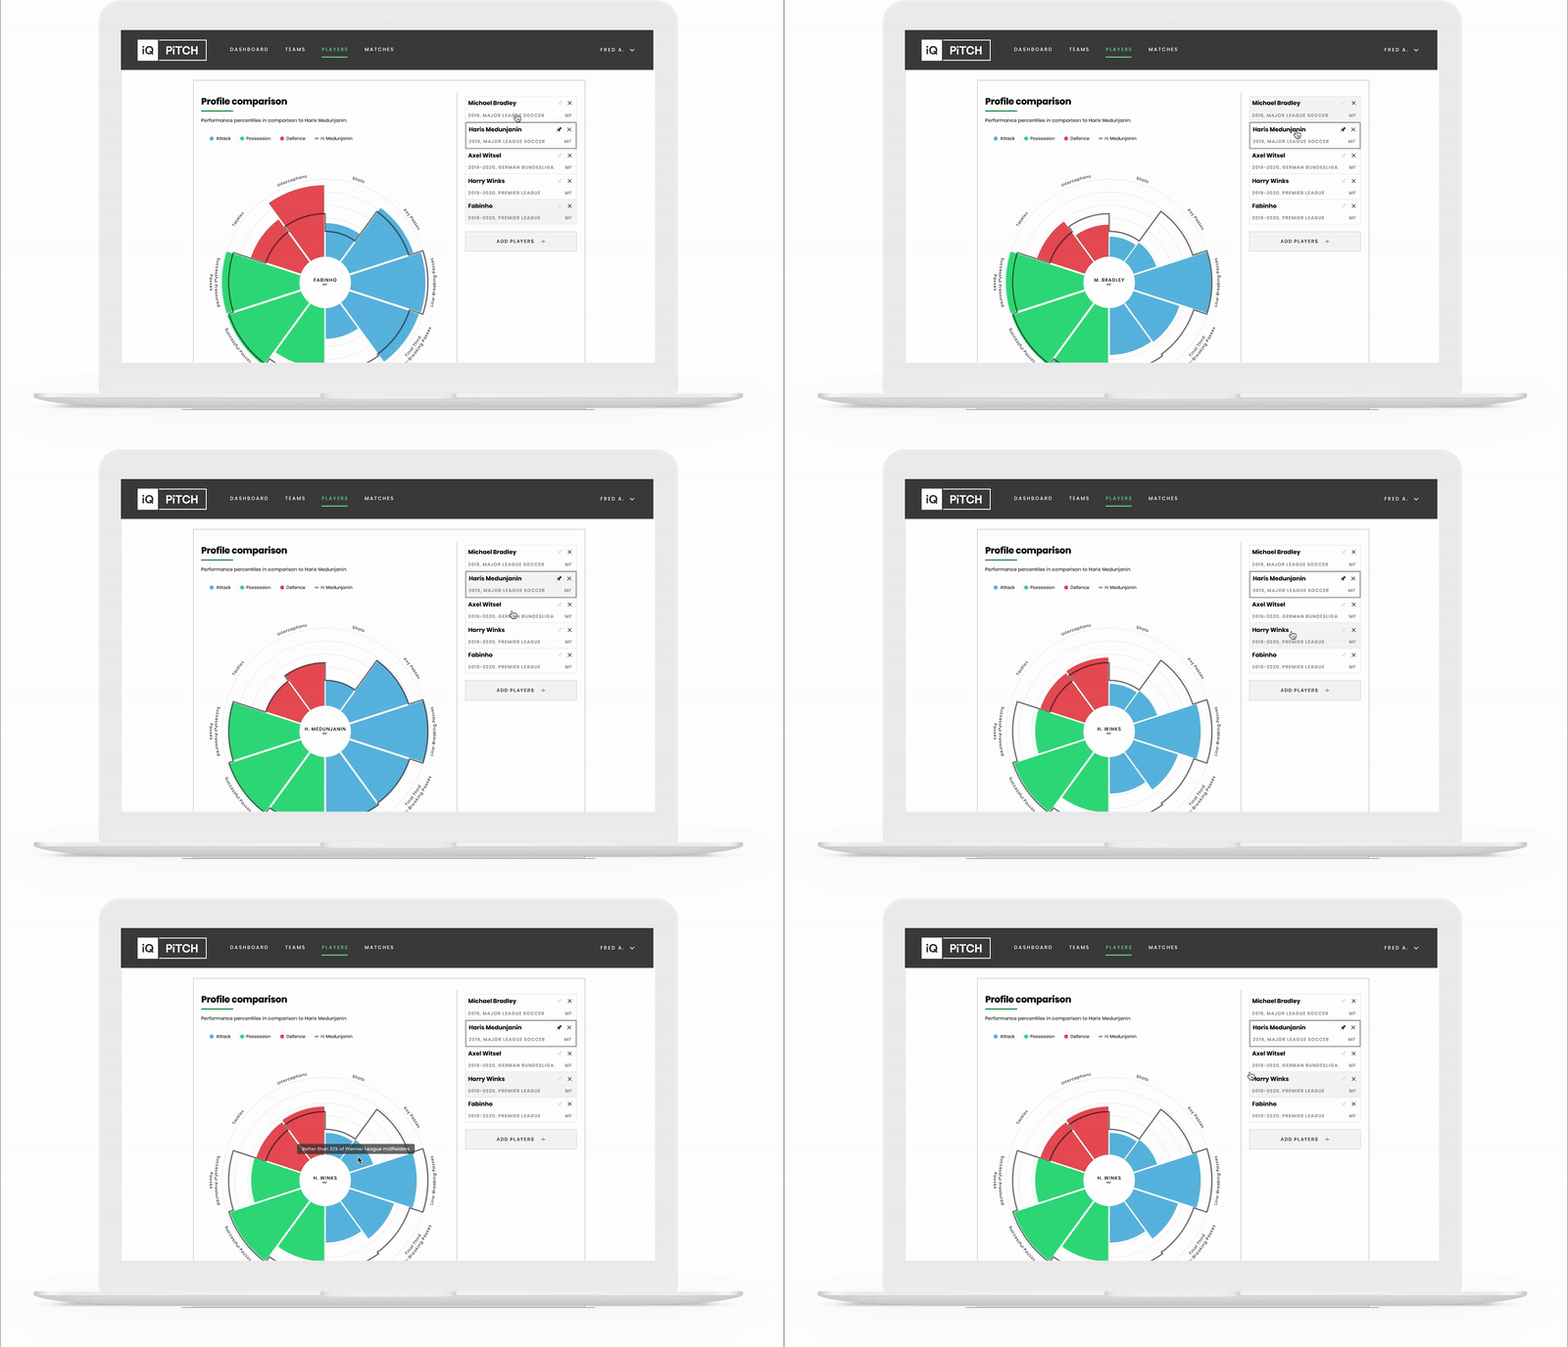
A player comparison feature was created with user-customisable metrics in order to allow users to deep-dive into the similarities and differences between players across different leagues.
By incorporating a ‘similar to:’ feature, clubs were able to see similarly performing players across leagues who may be more budget-appropriate to recruit.
DELIVER
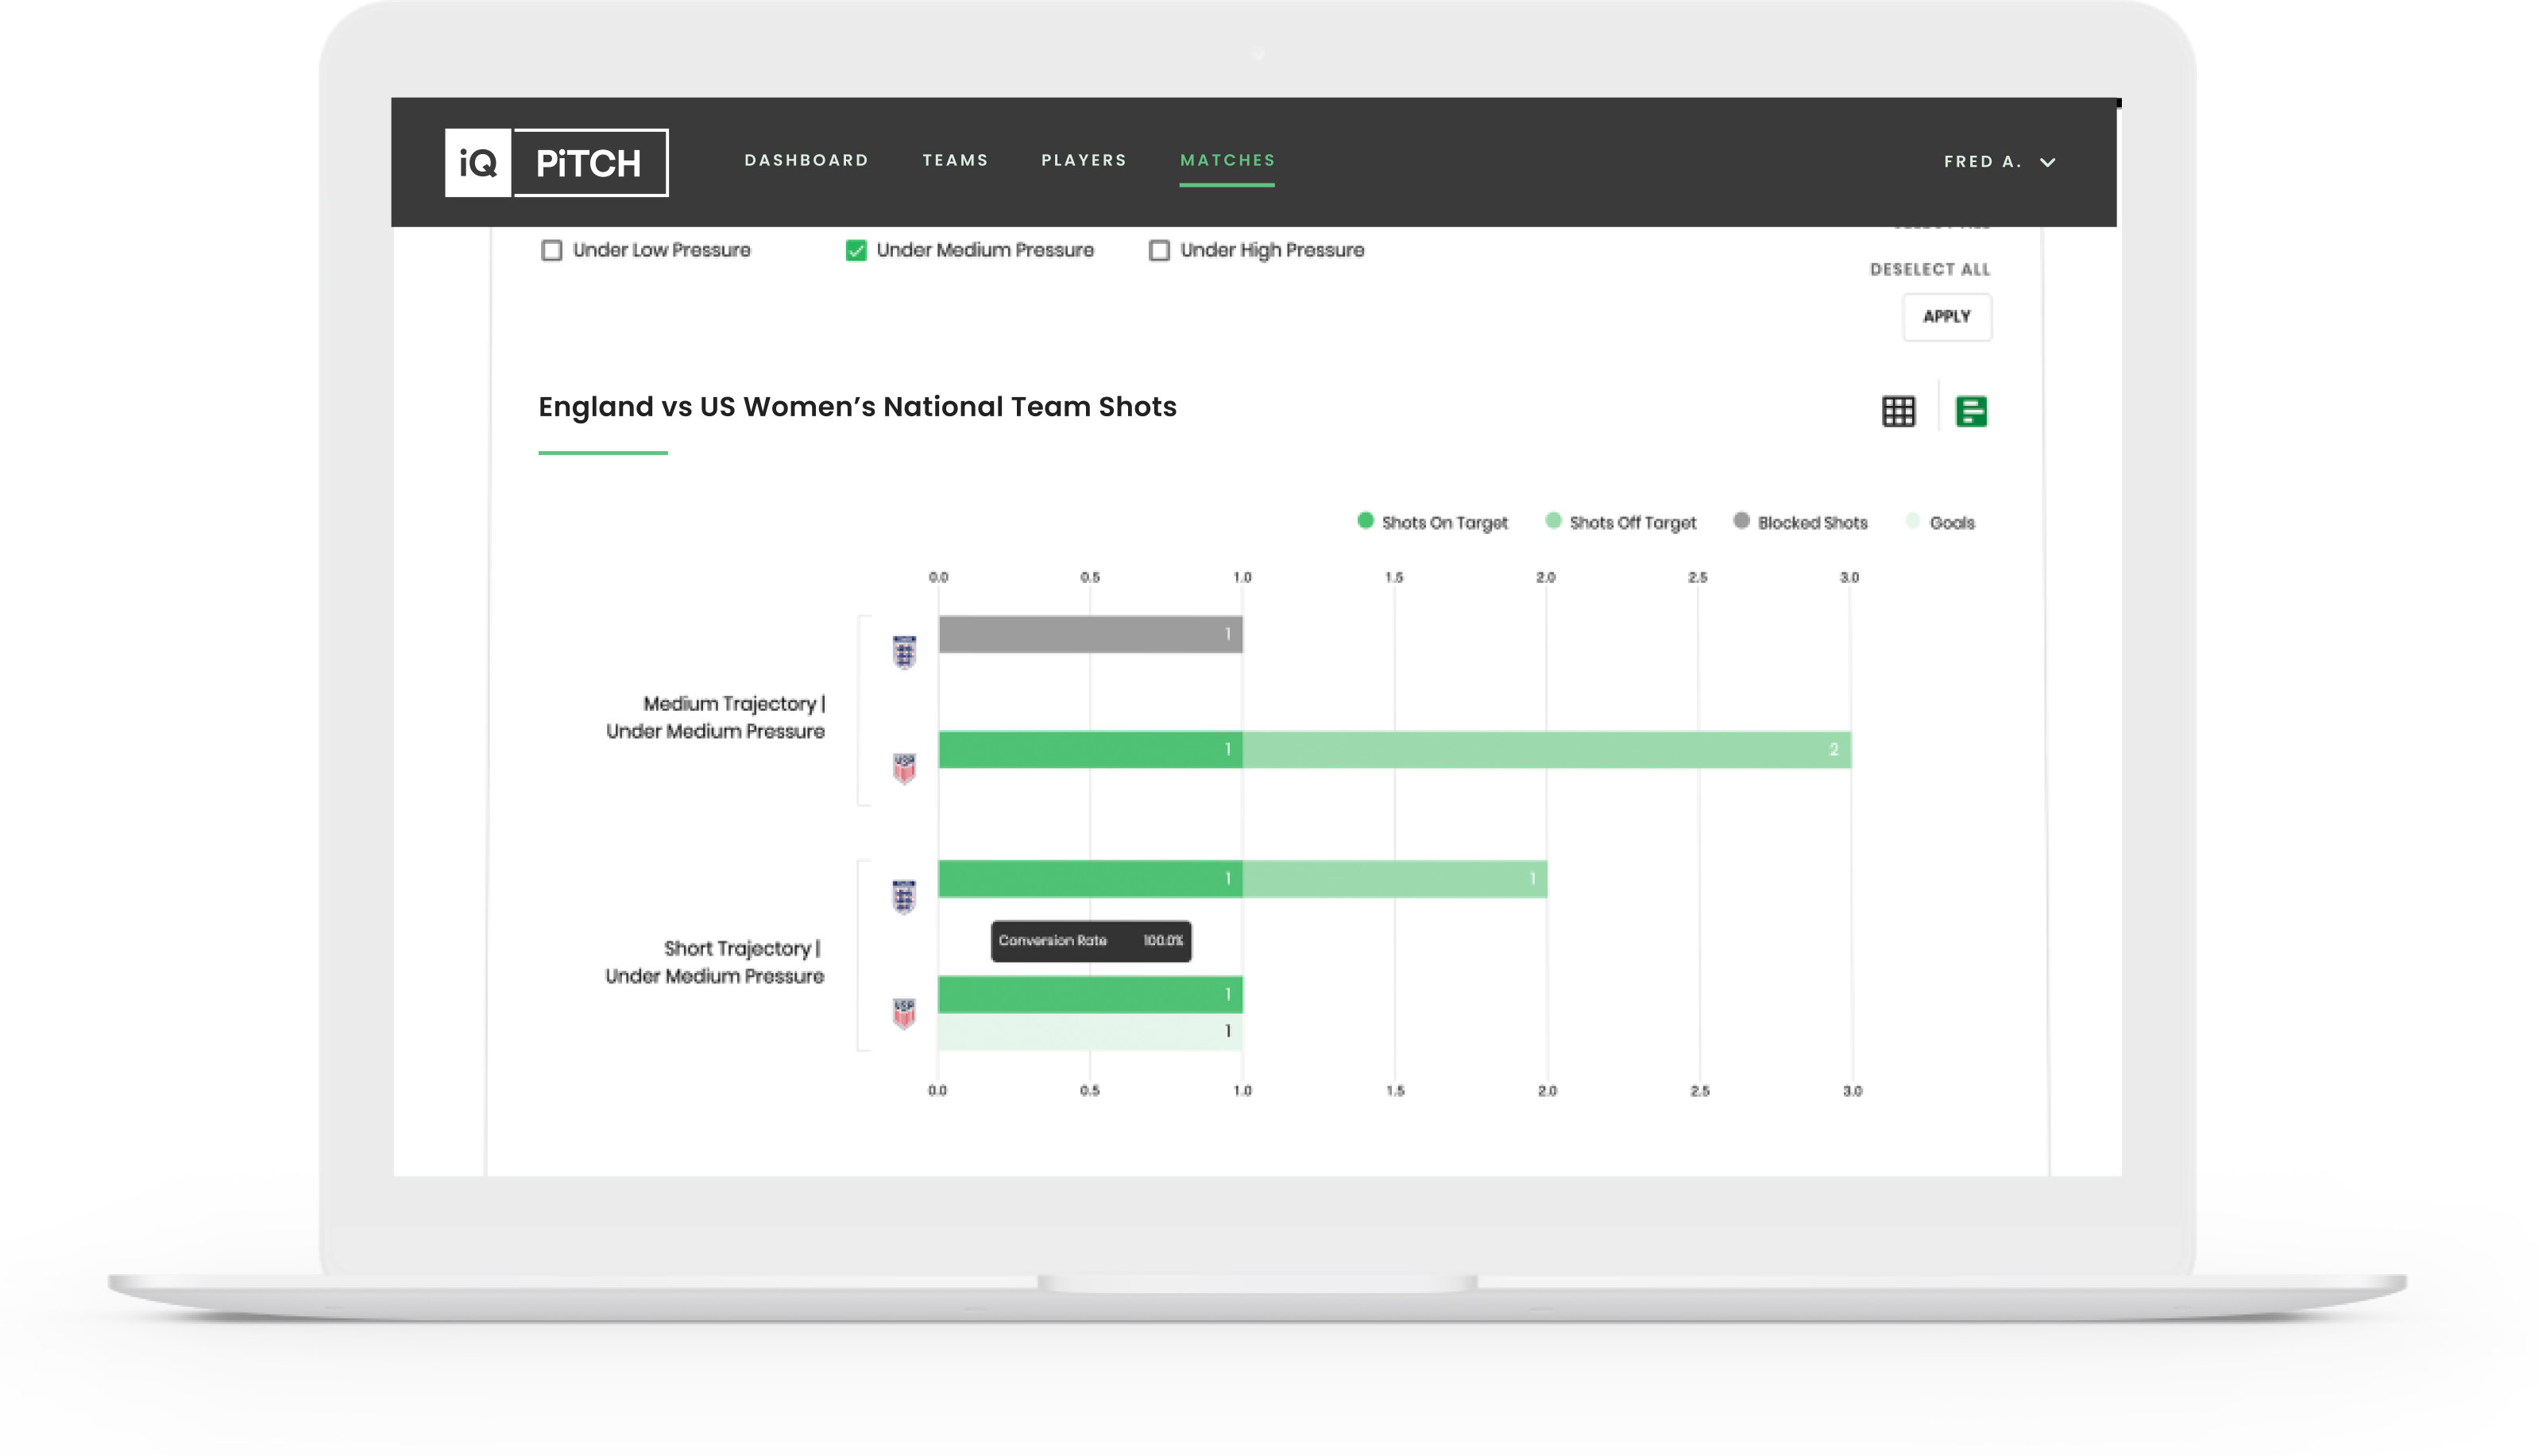
Team Profiles & Comparisons
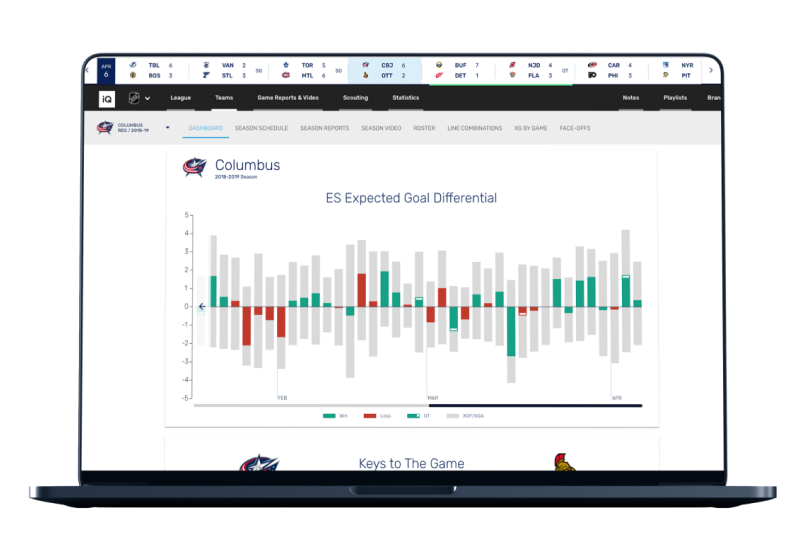
For fixture planning and debriefing, statistics based on team performance on each third of the pitch was shown to help coaches both plan their tactics and approach against an upcoming opponent, and understand their own team’s performance following a match.
The user had the flexibility to apply multiple filter options to get exact, targeted examples of a combination of contextual metrics.
DELIVER
Video Linking
The product was developed for pitch-side use during matches by coaches on a tablet, as well as for desktop viewports for deep-diving before or after fixtures.
Each statistic links to a smart playlist of every video instance of players performing particular actions. This allowed;
- coaches to minimise the time spent searching for video documentation for half-time briefings
- individual trainers and player managers to collect and download specific examples for player development
- scouts to be able to present recommendations for transfer windows
DELIVER
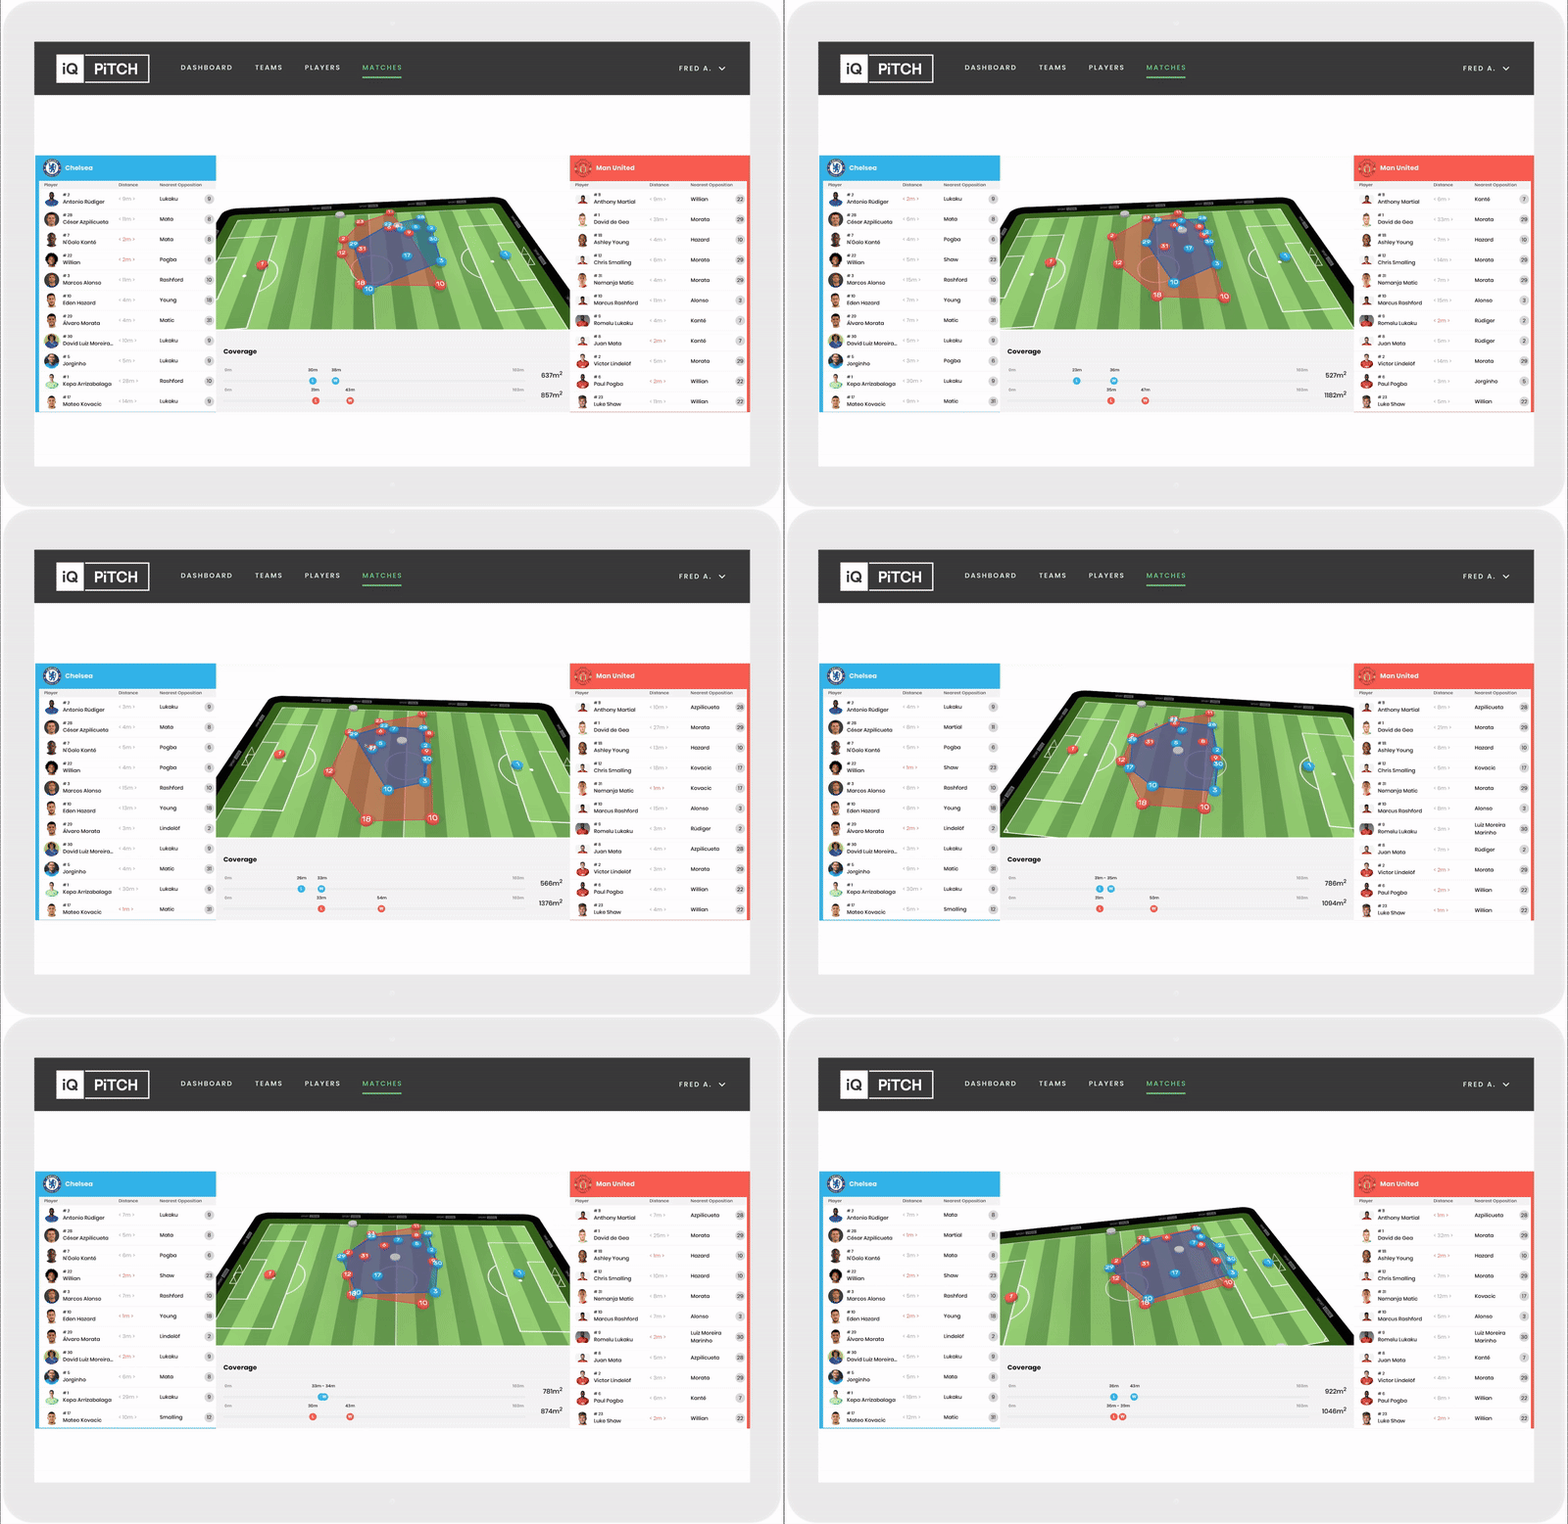
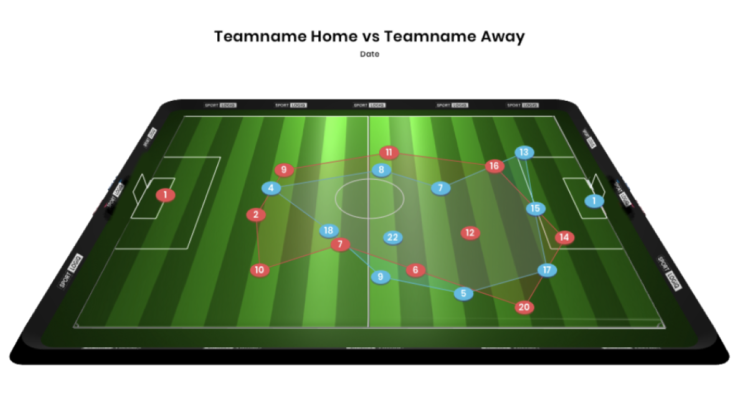
Team Positioning
A model view of the players’ comparative positioning as well as an elastic coverage area was created so that coaches could follow a complete view of the match, and not just what’s broadcast in order to:
- make changes on the fly
- assess performance at halftime or post-game
- plan against an oppositional team
DELIVER
Top Players & Teams
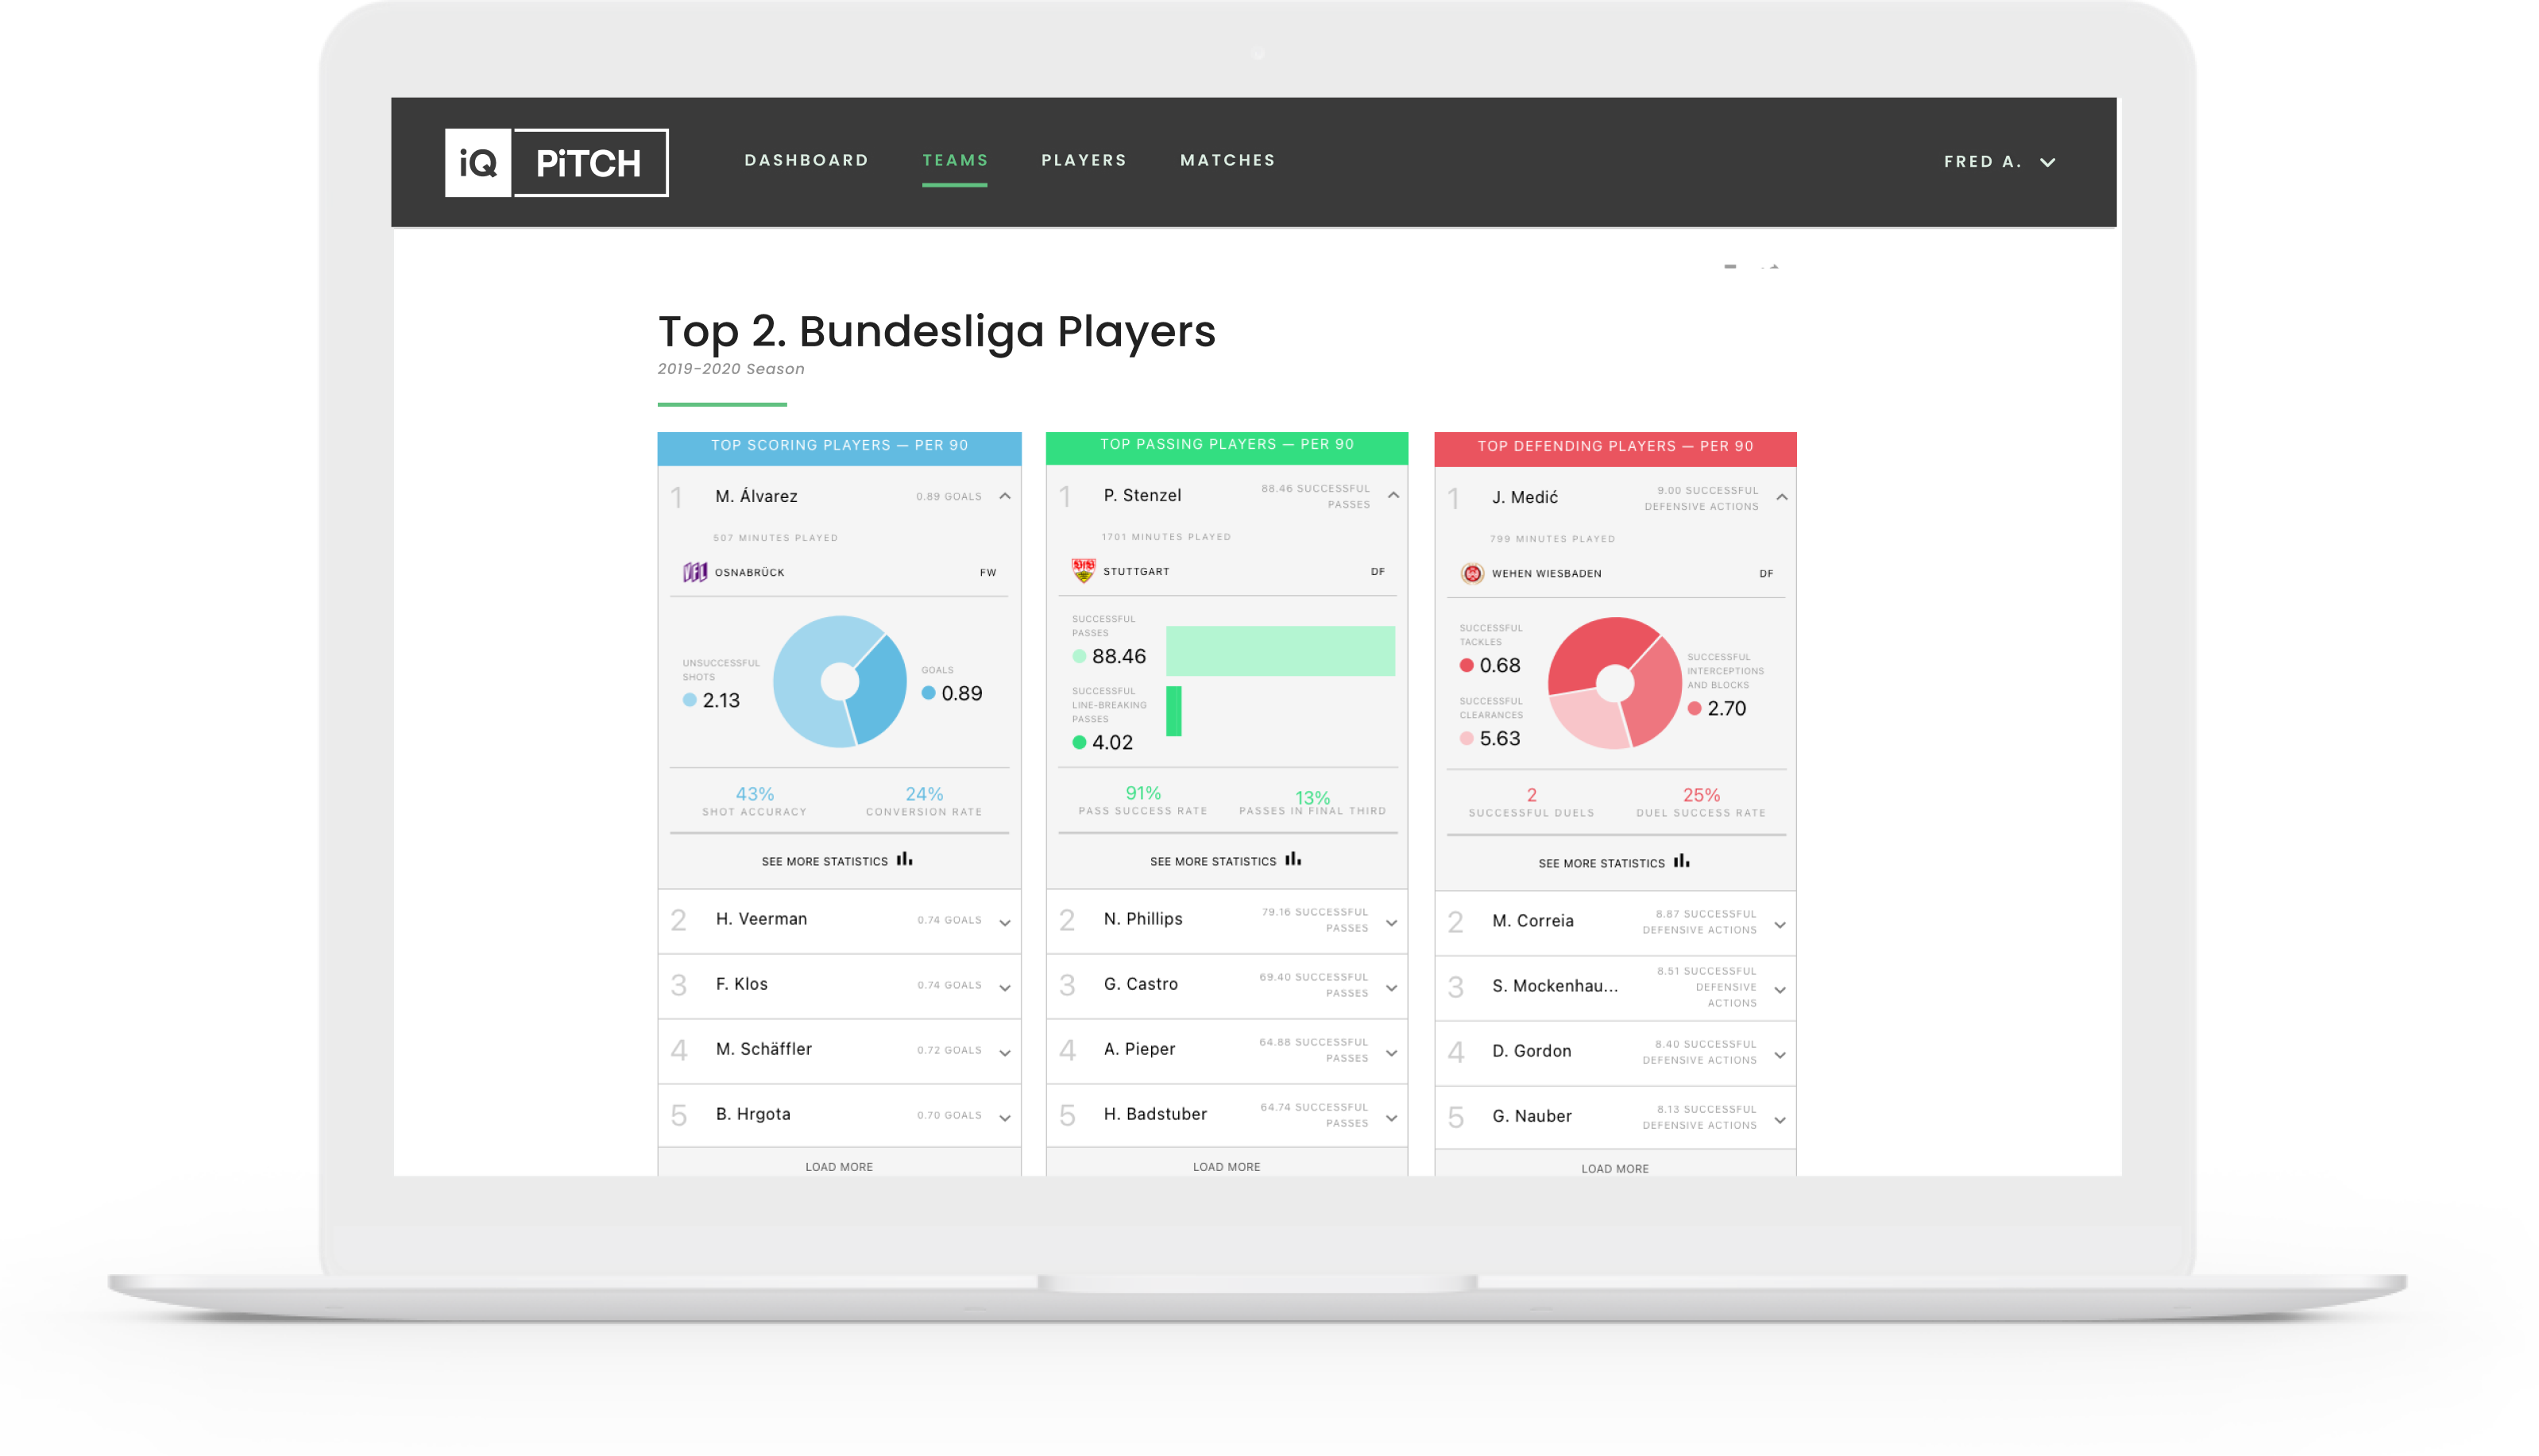
For each league, a number of main data points per player were ranked and fed into an algorithm which highlighted the top scoring, passing and defending players across teams.
This allows users to get a snapshot of which individual players they should be looking at if they are preparing for a fixture, or scouting for new players in certain leagues. Similarly, a top teams landing page was created to identify strengths and weaknesses of an opponent, or get more context around a league.
Outcomes
Clubs who had participated in free alpha-testing signed up to become paying customers:
83% conversion rate
Secured funding for
15 leagues: 9000+ players from 300+ teams
Helped the US Women’s National Team
win the 2019 World Cup


